Laboratory
-
NTA Principle
-
NTA Sample Prep.
-
NTA Measurement
-
NTA Data Analysis
Summary of Analytical Technique
Nanoparticle Tracking Analysis (NTA) tracks scattered light signals from small particles in the suspension using a microscope equipped with charge-coupled device (CCD) or scientific complementary metal-oxide-semiconductor (sCMOS) camera over multiple frames. Nanoparticles (NPs) in suspension move under Brownian motion. This motion is related to the particle size based on the Stokes-Einstein equation. NTA software adopts this equation to estimate the size distribution and concentration of all types of nanoparticles at 10 nm to 2000 nm in diameter and 106 to 109 particles per mL. For bimodal mixture samples, NTA can distinguish size differences of 25% (1:1.25 ratio). Thus, compared to the more commonly used DLS (Dynamic Light Scattering) technique, NTA is able to measure the hydrodynamic size of NPs with better size resolution in a small concentration range, although the applicable size range is narrower than DLS technique.
Principle of Analytical Technique
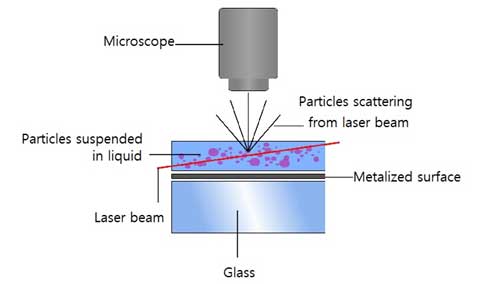
NTA combines a microscope and a CCD camera to visualize and record scattered laser light from suspended nanoparticles. The hydrodynamic diameter of particles, bubbles or other liquid droplets dispersed in the suspension is related to the Brownian motion parameter of the Stokes-Einstein equation. NTA software identifies and tracks NPs moving under Brownian motion, and measures particle movement values to determine particle size based on a formula derived from the Stokes-Einstein equation. Since the measured particles are assumed to be completely spherical, the actual size and the measured size become similar if the sample particles are close to the sphere.
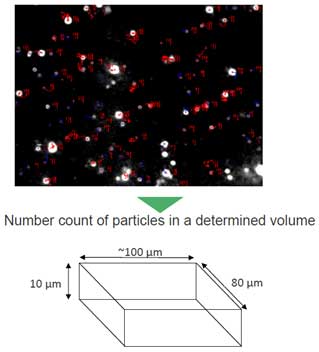
The amount of light scattering and the speed of Brownian motion depend on the size and composition of the particles. NTA can measure particle size by measuring the intensity of scattered light and tracking the particle position with Brownian motion. Generally, Brownian motion of small particles is fast and the scattering of large and metal particles is strong. Concentration is measured from the number of particles measured in a specific volume specified by the manufacturer(see Figure 3).
- a. measurable particle size: 10nm ~ 40nm < diameter < 1~ 2μm
- b. measurable concentration: ~106 particles/mL < conc. < 109 particles/mL
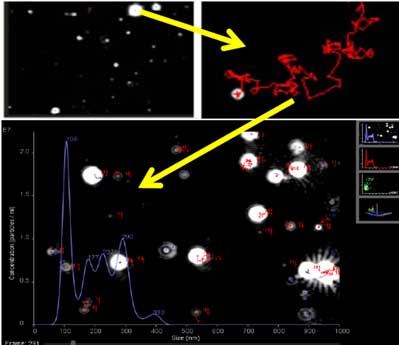
The average spatial displacement of particles per unit time can be calculated by tracking individual particles in arbitrary Brownian motion frame in units of frames. Frames are still images obtained by capturing video of moving particles in NTA device. This displacement is related to the hydrodynamic diameter of the particles in the Stokes-Einstein equation. Brownian motion is a three-dimensional process, but hydrodynamic diameter of a particle can be found using one-, two-, or three-dimensional diffusion coefficients (three equations below).
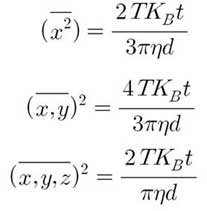
The above equations are the mean square displacement values of 1D, 2D and 3D, respectively. t is the time between sequential displacement measurements. NTA assumes motion in two dimensions and uses the following equation:
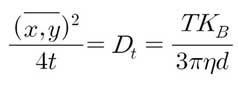
A 20x magnification microscope and camera tracks the Brownian motion of each particle in real time via video. The diffusion coefficient (Dt) is obtained by measuring the mean squared displacement (displacement of particles over time) in two dimensions with particle tracking software.
Stokes Einstein equation is used to determine the size of the hydrodynamic sphere (d). Particle size (d) is calculated, and what NTA actually measures is the speed of particle move. Thus, temperature (T) and viscosity (η) affect the calculated particle size. The number of particles to be measured depends on the sample concentration, scattering volume, particle size (since it affects the diffusion rate) and analysis time. The larger this number, the better the reproducibility of the entire sample. If the size distribution is wide, more particle measurements are required because the number of statistically significant particles in each size class of the distribution must be measured. For monodisperse samples, less than 100 particles are sufficient for measurement.
DLS shows the average value of a sample, so it is good to know the representativeness, but it is difficult to distinguish the characteristics of individual particles. On the other hand, NTA tracks individual particles and provides a statistical distribution of particle sizes, so that sample information does not disappear based on signal strength. NTA can distinguish size differences of 25% (1:1.25 ratio) but DLS can distinguish differences by more than 300% (1:3 ratio)[7].
References
- [1] Malvern Panalytical, Zeta Potential & Practicle Size Analyzer User Training Manual (2018).
- [2] Particle Size Analysis-Praticle Tracking Analysis (PTA) Method, ISO 19430 (Switzerland, Geneva, 2016).
- [3] Standard Guide for Measurement of Particle Size Distribution of Nanomaterials in Suspension by Nanoparticle Tracking Analysis(NTA), ASTM E2834 (2018).
- [4] Malvern, NANOSIGHT LM10 NTA SOFTWARE GUIDE MAN0546-01-EN-00 (2014).
- [5] Malvern, NANOSIGHT LM10 OPERATING MANUAL MAN0510-04-EN-00 (2015).
- [6] Malvern, NANOSIGHT NS300 NTA SOFTWARE GUIDE MAN0545-01-EN-00 (2014).
- [7] V. Filipe, A. Hawe, and W. Jiskoot, “Critical Evaluation of Nanoparticle Tracking Analysis (NTA) by NanoSight for the Measurement of Nanoparticles and Protein Aggregates,” Pharmaceutical Research 27, 5 (2010).
Sample Preparation
Solid powder
Generally, reagents related to this technique are not required. However, in order to maintain colloidal stability during measurement, certain samples often require dispersants and stabilizers. Proper dilution is necessary to obtain an appropriate particle concentration for the measurement. As the property or concentration of the ionic environment in which the particles are dispersed changes, the hydrodynamic size or diffusion coefficient of the particles may change.
- 1. Prepare a solvent (e.g. DI water) in a clean sample tube and add powdered solids.
- 2. Disperse the sample for 5-15 minutes using a sonicator.
Liquid suspension
- 1. Prepare filtered deionized water (DI water, over 18.2 Mohm, TypeⅠ) and a clean sample tube.
- 2. Dilute the NP suspension in the sample tube with DI water (To dilute 1:50, inject 4900 μL DI water and add 100 μL NP suspension).
- 3. Mix using a vortexer.
Cautions
- - For NTA measurements, there should be no sedimentation of the sample, and the Brownian motion of the particles is sensitive to vibration (especially large particles), so there should be no ambient vibration.
- - Adjust the particle concentration so that approximately 10 to 100 particles are displayed on the screen.
- - Since the fluorescent sample has a short fluorescence lifetime, it is important to block ambient light and the measurement must be performed quickly. When using a fluorescent sample, wrap the tube with aluminum foil to avoid light exposure. Or use a brown tube.
- - Secure the sample tube so that it does not move when mixing through a sonicator.
- - Use a luer fitting syringe. At this time, be careful when injecting the sample as the narrow hole (e.g. 1-2 mL) syringe body may accidentally generate high pressure.
- - When use the LM10, the chamber can only contain 0.5 mL of sample.
- - For metal NPs such as Au NPs, store at 4°C and dilute before NTA measurements.
※ The NanoSight system mainly measures the concentration range of ~107-109 particles/mL, which is the concentration at which 20 ~ 100 particles are observed on the screen. The recommended concentration is about 3X10⁸ particles/mL, with 30-80 particles on the screen.
Measurement
Instrument Information
- 1. Instrument: Malvern NanoSight LM10 & NS300
- 2. S/W: NanoSight NTA 3.3 Analytical Software (LM10), Nanosight NTA 3.4 Analytical Software (NS300)
Instrumental setting for experiment
- 1. LM10: 642 nm Laser
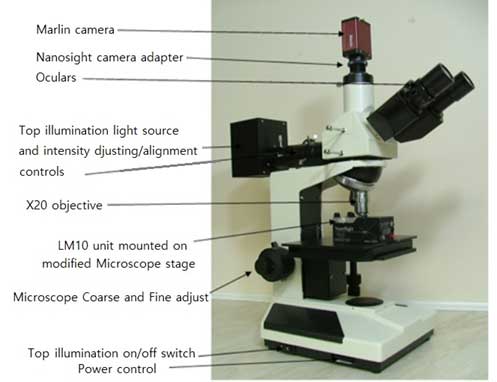
Figure 1. LM10. Hardware of LM10
- Camera connected to PC
- Laser module
- Microscope
- External thermometer
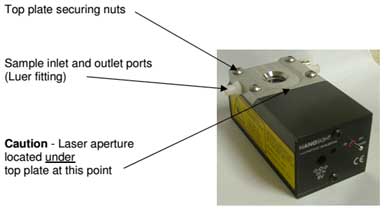
Figure 2. Laser module and sample inlet. 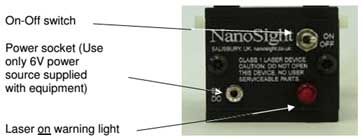
Figure 3. Laser module and laser power switch - a. Sample loading
Turn off the power and remove the power connector from the sample holder. Inject the sample into the chamber of the O-ring Top-Plate using a 1 mL syringe. There should be no air bubbles in the syringe. To avoid air bubbles in the chamber of plate, place the sample inlet downward and slowly inject the sample from the bottom up. After injecting the sample, reconnect the power connector and place it on the microscope. Turn on the laser and connect the thermometer.
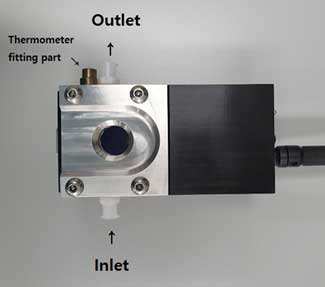
Figure 4. O-Ring Top-Plate of LM10. - b. Run Software (see Startup Software on p10)
Turn on the NTA device first, then run the software.
- c. Measurement
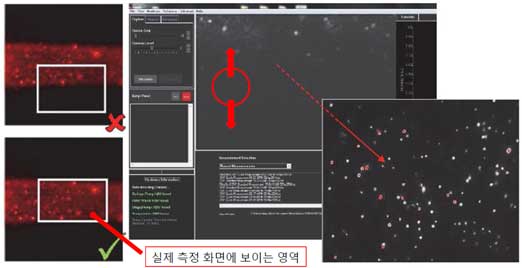
- i. The focus must be adjusted manually. Adjust the focus while observing the nanoparticles through the microscope and readjust the focus while looking at the monitor screen(pull the light path selector knob next to the microscope to observe through the PC).
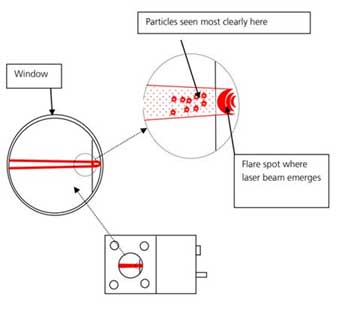
Figure 5. Particles Identification through microscope. - ii. Check the chrome line and thumbprint position with a microscope and readjust with the fine focus knob while viewing it on the software screen.
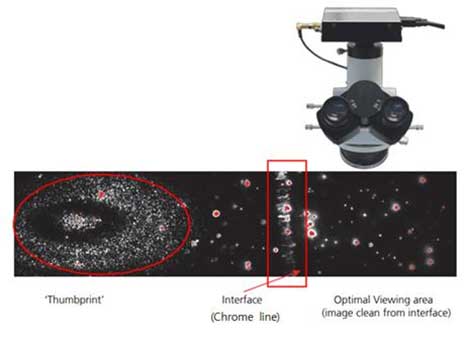
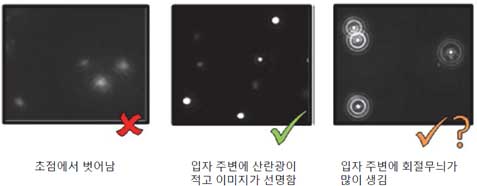
Figure 6. Thumbprint, chrome line, optimal viewing area. - iii. Adjust the image quality while adjusting the camera level. Adjust the focus so that scattered light does not appear around the particles.
※ Since Brownian motion is highly affected by the ambient vibration, it should be measured in the absence of ambient vibration.
For more information, see ‘C. Software execution’.
- i. The focus must be adjusted manually. Adjust the focus while observing the nanoparticles through the microscope and readjust the focus while looking at the monitor screen(pull the light path selector knob next to the microscope to observe through the PC).
- d. Cleaning
- i. Place several tissues on the experimental table.
- ii. Remove the sample holder, turn off the laser, and disconnect the power cable.
- iii. Pull the syringe piston to collect the sample. Tilt the sample holder, add DI water and wash 3 to 5 times.
- iv. To remove the remaining DI water, tilt the sample holder downwards and blow the air using a syringe.
- v. Unscrew the sample holder, wipe off any remaining DI water from the laser module, and dry it completely.
- vi. Blow air into the holes in the O-ring top-plate to dry.
- vii. Reassemble the separated sample holder. Tighten gently when tightening the screws. To maintain the O-ring top-plate level, connect the screws in a diagonal combination.
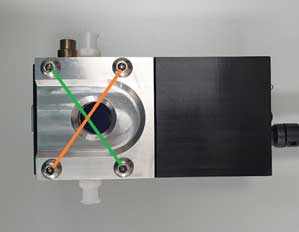
Figure 7. Tighten the bolts sequentially in a diagonal combination. ※ Notes on Cleaning: Wipe gently wipe the optical plate part in one direction with lens-cleaning tissues. The syringe used for cleaning should be used only once and discarded to prevent contamination.
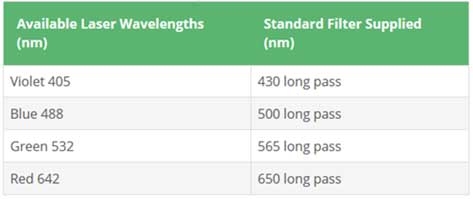
- 2. NS300: 405nm, 488nm Laser (430nm/500nm filters, ND 1 filter)
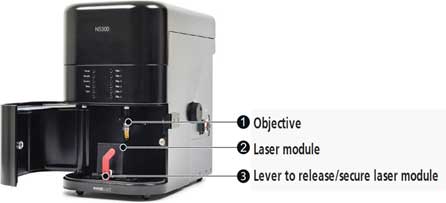
Figure 8. NS300. Hardware/Software Features of NS300
- Internal temperature controller: 5 to 50 ° C (preferably not more than 50 minutes)
- Automatic temperature input in NTA software
- Low Volume Flow Cell(LVFC)/O-Ring Top-Plate
- Auto-focusing available
- No need to move x-y stage after mounting laser module
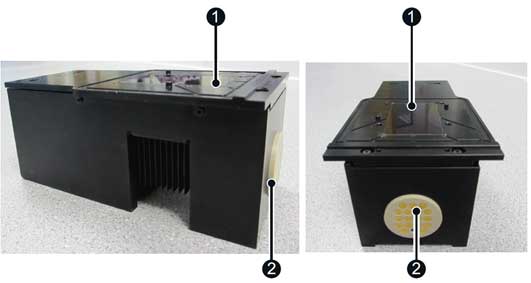
Figure 9. Laser module: 1-optical flat element, 2-electrical contacts. 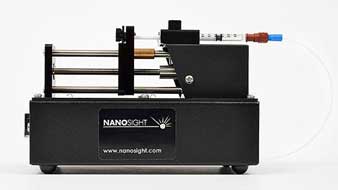
Figure 10. syringe pump. - a. Sample loading
The NS300 has two sample holders:
- i. O-Ring Top-Plate
- Same as LM10. Carefully insert the sample into the O-Ring Top-Plate with a 1 mL syringe.
- ① While injecting the sample, tilt the plate to insert the sample from bottom up to prevent air bubbles.
② The O-Ring Top-Plate can be used to measure samples except fluorescent samples.
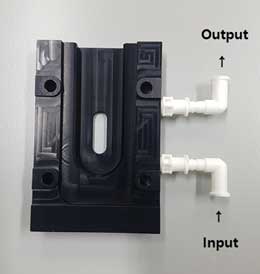
Figure 11. O-Ring Top-Plate - ii. Low Volume Flow Cell (LVFC)
LVFC is useful when the amount of sample is small and can be used to measure fluorescent samples. Use DI water-based solvents if possible because it is vulnerable to fat-soluble, organic solvents, and pH.
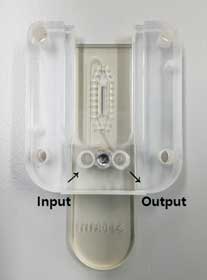
Figure 12. Low Volume Flow Cell (LVFC). - ① Insert a sample using the input line. When you insert a syringe into the line, bubbles may enter. So a few drops of the sample are dropped into the Syringe Pump Tubing, and then the syringe is plugged in.
- ② Tilt the LVFC to insert the sample. When the sample reaches the midpoint of the cell, change the cell direction up and down so that the sample is inserted evenly.
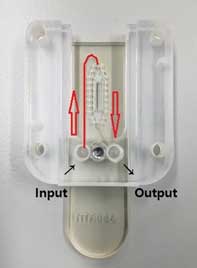
Figure 13. Turn the LVFC in the opposite direction when the sample reaches the branch point (red line). - ③ After loading the sample, secure the laser module and adjust the focus knob.
※ When ijnspecting fluorescent samples, wrap the syringe in aluminum foil to block the light and, if necessary, perform a sample measurement in flow mode using a syringe pump.
- i. O-Ring Top-Plate
- b. Run Software(see Startup Software on p10)
Turn on the NTA device first, then run the software. Check the connection between the system and the PC in the software.
- c. Measurement
For NS300, auto focusing is available. First, use autofocus to focus, then use the fine focus knob to refocus if necessary. The NS300 has a neutral density (ND) filter and fluorescent filters.
- i. ND filter is used when the scattering intensity of particles is high. It reduces the amount of light that pass through the filter at a constant rate. NS300 uses an ND1 filter that transmits ~ 10% of the scattered light.
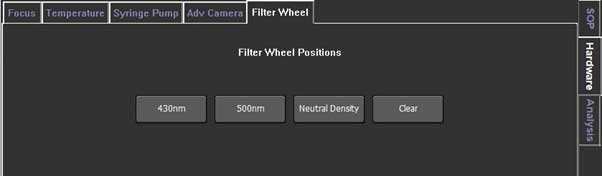
- ii. Fluorescent filters are used to measure fluorescent samples. It is necessary to use an appropriate filter depending on the wavelength of the laser and sample. Always set the camera level to 16, the maximum when measuring fluorescent samples. If the light level is too high, reduce the camera level.
- i. ND filter is used when the scattering intensity of particles is high. It reduces the amount of light that pass through the filter at a constant rate. NS300 uses an ND1 filter that transmits ~ 10% of the scattered light.
- d. Cleaning
- i. Remove the sample and wash slowly with DI water using a 10 mL sterilized syringe.
- ii. The flow rate of DI water is 1 mL for 20 seconds. DI water should be free of bubbles.
- iii. After washing, turn on the camera and set the camera level to 16 and then check the screen for residue. If particles remain, repeat the cleaning procedure.
- iv. If no more particles are visible on the camera screen, loosen the screws to separate the laser module and plate. Wipe out the remaining DI water.
- v. Tubing and top-plate should be dry when not in use.
※ Notes on Cleaning: Wipe Gently wipe the optical plate part in one direction with lens-cleaning tissues. The syringe used for cleaning should be used only once and discarded to prevent contamination.
Startup Software
- 1. Turn on the NTA device first, then run the software.

- 2. Check the device connection.
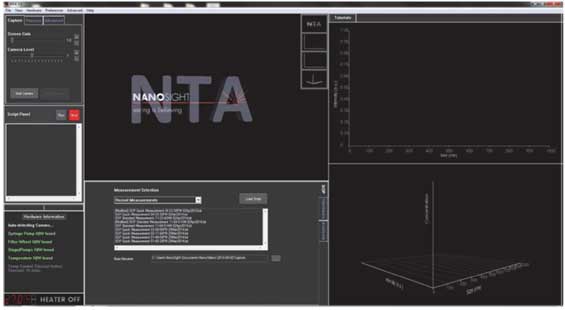
- 3. Check the initial image and adjust the screen gain and camera level.
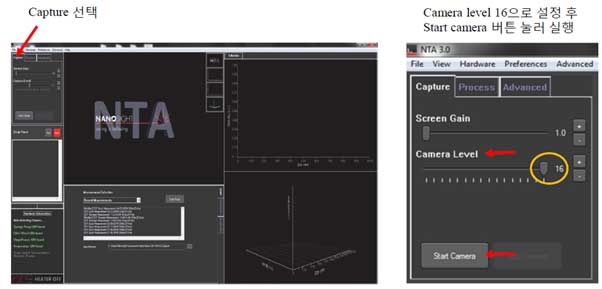
- a. Screen gain adjusts the sharpness of the screen and adjusts only user's screen so it does not affect the data
- b. Camera level works like an iris, which affects the data. User need to adjust while viewing the screen.
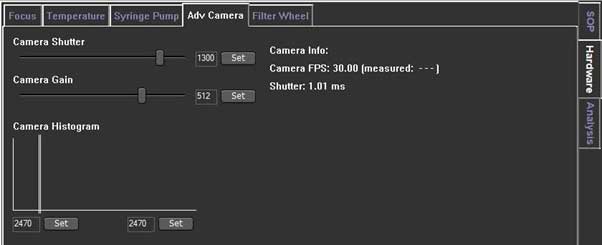
You can control the Camera shutter and Camera gain in the Adv Camera tab of the Hardware tab.
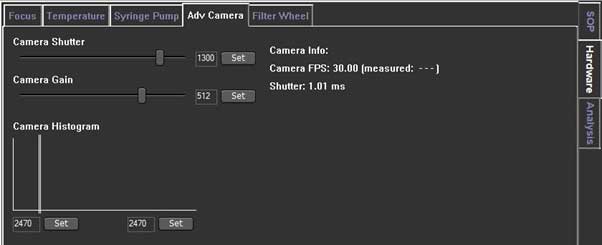
- Determines how long the camera electronic shutter is open and how much light is captured from the particles. Faint particles (associated with small particles with a low refractive index) usually be captured with longer shutter time.
- if the shutter setting bar turns red, the camera is overexposed, so you need to reduce the shutter setting until the red warning bar disappears.
- Camera Gain is a setting that increases the camera's sensitivity. Since you need to see the smallest particles in the sample, operator need to increase the gain so you can track and analyze it.
- To visualize all particles in an unfamiliar sample, it is recommended to maximize the gain setting. If you can’t see small particles, you need to reduce the gain. This is beacause small particles do not exist.
- 4. Move the image to the center of the screen. Make the particles visible on the entire screen.
- a. LM10 can move the stage in the x-y direction.
- b. The NS300 can be moved up and down by dragging the screen with the mouse.
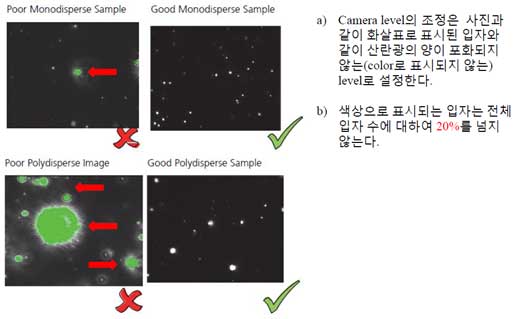
- 5. Adjust the focus of the particles. There should be little scattered light around the particles and the image should be sharp. Ensure that there is no halo around the particles if possible.
- 6. Adjust the particle concentration.
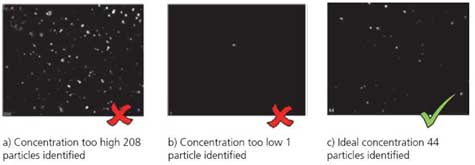
Too many particles can affect the movement of the particles, and scattered light from other particles can result in improper measurements. Therefore, the number of particles that can be seen on the screen (field of view) is suitable for 30 to 80.
- 7. There are three measurement modes. Select the desired mode and click Run script to being the measurement.
- a. Recent measurements show the 10 most recent measurements, allowing user to quickly repeat the measurement.
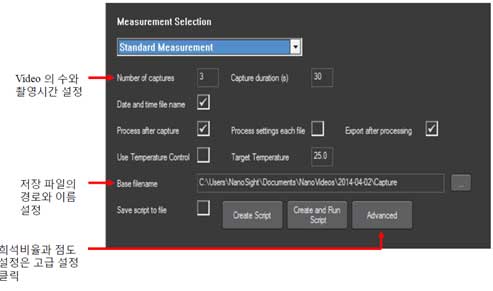
- b. Standard measurement is suitable for measuring the size and concentration of most samples within the instrument specifications.
- i. Standard sample is measured 3 times for 30 seconds.
- ii. Measure 3 to 5 times every 60 seconds for a normal sample.
- iii. Polydisperse samples usually show different results for each measurement. In this case, increase the duration time (2-3 minutes) and the number of measurements.
- iv. If the sample concentration is too low, increase the duration time as well.
- c. Quick measurement is used for quick measurements and a single video is created and analyzed.
Too many particles can affect the movement of the particles, and the measurement may not be performed properly due to scattered light from other particles. Therefore, the number of particles visible on the screen (field of view) is 30 to 80 as described in <III Sample Preparation C Precautions>.
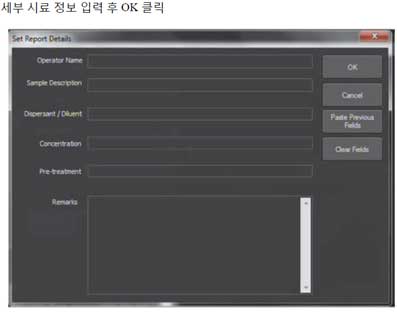
- 8. Click Run script, enter sample details, and click OK.
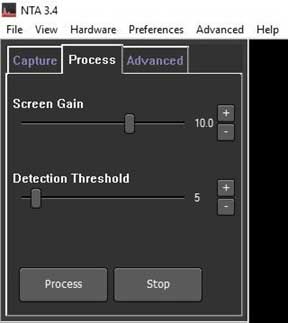
- 9. Set the detection threshold before processing the captured video.
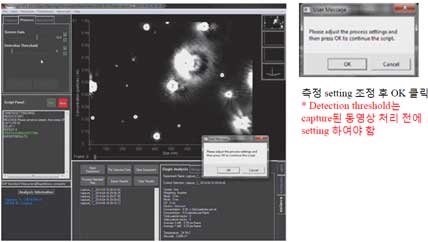
Adjust the detection threshold to select the particles to be included in the trace. The detection threshold must be determined by the user to determine whether it is a real particle or not. To check the real particle trace, move the slide at the bottom of the screen to identify particles in the entire video frame and then determine the detection threshold.
- a. If the detection threshold is low, the trace also includes faint particles (blue crosses on the screen). Blue cross symbol means noise.
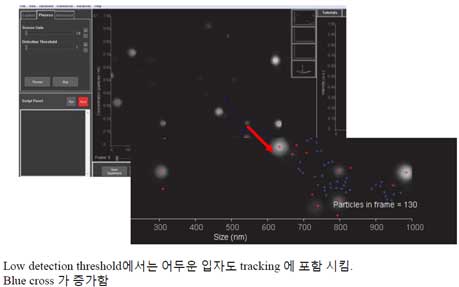
- b. Increasing the detection threshold, reduces the number of blue cross and trace particles.
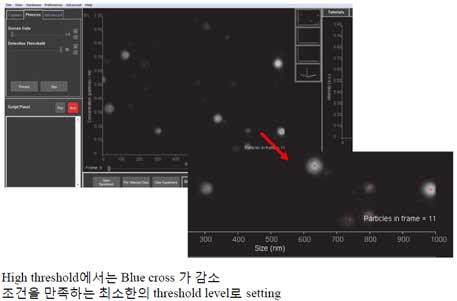
- a. If the detection threshold is low, the trace also includes faint particles (blue crosses on the screen). Blue cross symbol means noise.
- 10. Start tracking. The following three pieces of information appear on the screen.
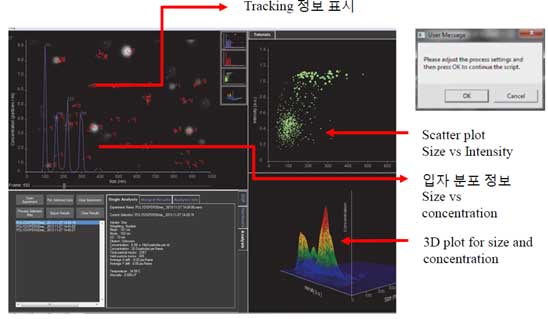
- a. Scatter plot vs Intensity
- b. Size vs Concentration
- c. 3D plot for size and concentration
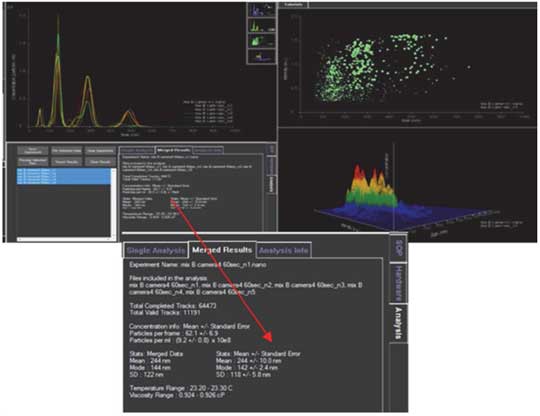
- 11. Check the results.
※ NS300 flow mode
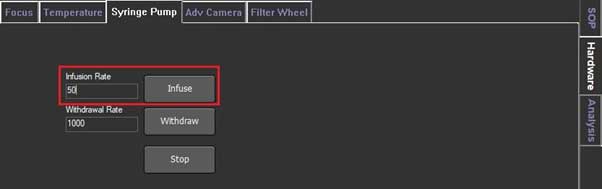
NS300 can be measured in flow mode using a syringe pump.
- 1. In the Hardware, click the syringe pump and set the infusion rate to 1000, then click Infuse.
- 2. When the syringe piston starts to move, reduce the infusion rate as desired and click the Infuse again.
(It is recommended to adjust the particles to disappear from the screen for about 10 seconds. Infusion rate is usually about 50. However, it is better to judge the time by watching the screen. Because the particle's moving speed changes with size).
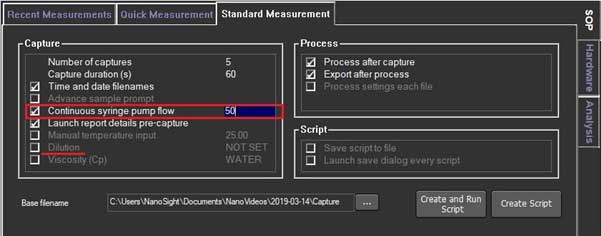
- 3. In SOP, check the continuous syringe pump flow and set it at the same rate as the Infusion rate.
- 4. Check the Dilution and add the dilution ratio, the program calculates the original concentration when the results are obtained.
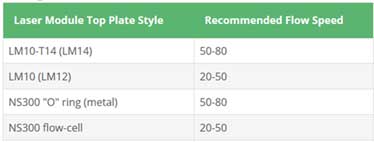
- 5. Flow speed is shown in the following table.
※ Fluorescent sample
The NS300 can measure fluorescent samples.
- 1. Increase the camera level to the maximum and decrease histogram upper limit of ‘Adv Camera’ on the Hardware tab if necessary.
- 2. Adjust the focus and measure with ‘Standard Measurement’.
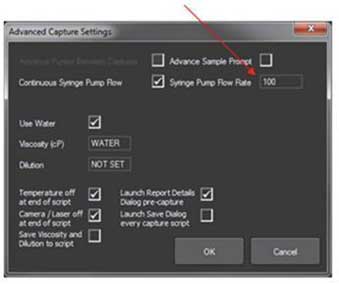
- 3. If using a syringe pump, select ‘Continuous Syringe Pump Flow rate’ and set the required rate in the Advanced capture settings window.
※ Measurement range of setting
You can change the graph that comes out when you measure
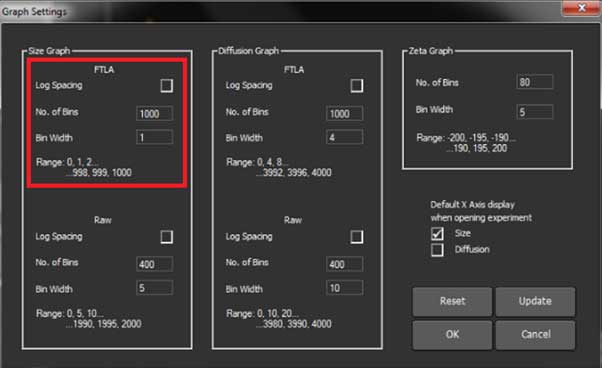
In the Software, select Preference -> Graph. When the graph
settings are displayed, you can set the No. of Bins in the size graph box (maximum value is 2000)
All images are taken from Malvern NTA manual.
Data Processing & Analysis
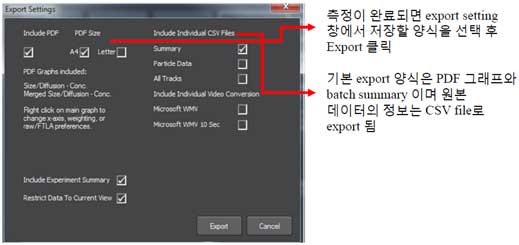
① Saving Data
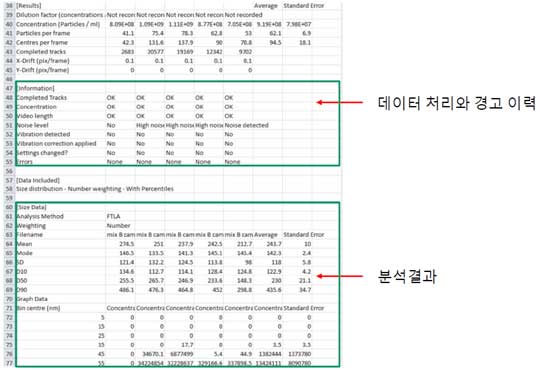
② Data analysis -PDF
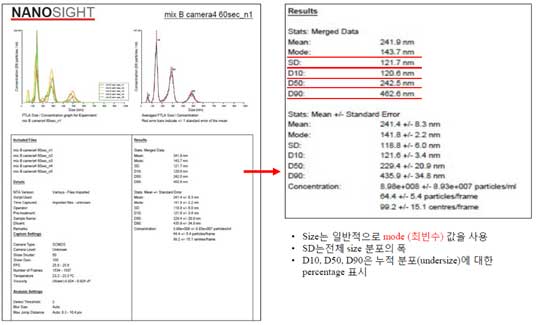
- Mode (modal particle size) refers the most common value among a group
- SD is a measure of the width (spread) of the particle size distribution.
- D10, D50, D90 are intercepts for 10%, 50% and 90% of the cumulative mass.
- If vibrations are detected during measurement, the sample size is measured to be smaller than the actual particle size.
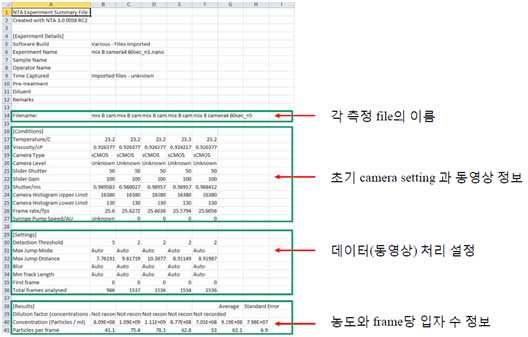
③ Data analysis-CSV
④ Create a report based on the following:
- 1. Measurement date
- 2. Experimenter
- 3. Sample information: sample name, product number, etc.
- 4. Dispersion solvent
- 5. Sample preparation method
- 6. Mean and mode of the hydrodynamic size, size distribution, concentration, diffusion coefficient.
- 7. Abnormal characteristics that affect test during measurement and analysis