Making Decision based on
"Good Measurement & Analysis Practice : TEM"
-
TEM Sample Prep.
Dispersion & TEM sample prep. Protocol 
MORE
-
-
TEM Image Analysis
TEM Image Analysis in s2nano.org
MORE
-
Decision on "NANO"
Decision-Making on "Nanomaterial" using TEM
MORE
TEM Sample Prep.
Dispersion & TEM sample prep. Protocol
|
ISO |
NanoREG |
ACEnano |
S2NANO |
| Method |
- Prepare suspension solution of NPs
- Drop suspension solution of NPs (5uL) on TEM grid & dry
|
- Pre-wetting sample using Ethanol
- Disperse sample in Bovine serum albumin-water (2.56 mg/ml) using probe sonication
- Drop & dry sample on TEM grid
|
- Drop suspension solution of NPs on TEM grid & dry for 0.5–1h
|
- Prepare suspension solution from NPs powder using water/ ethanol
- Drop suspension solution (5-10uL) of NPs on TEM grid & dry for 2-3h
|
| Instrument |
- Copper grid
- Inter-laboratory
|
- Copper grid: 400 mesh
- Inter-laboratory
|
- Copper grid: 300 mesh
- JEOL 1200EX TEM (accelerating voltage 80 kV)
|
- Copper grid: 300 mesh
- JEM-2010 TEM (accelerating voltage 200 kV)
|
TEM measurement
TEM measurement Protocols (NanoReg, ACEnano)
Summary of TEM Technique :
Principle :
- A high velocity electron beam is generated and accelerated under high vacuum, it is focused by condenser lens (electromagnetic bending of electron beam) onto specimen.
- Electrons are transmitted through the specimen.
- On the way through the specimen some parts of the material stop or deflect electrons more than other parts.
- The electrons are collected from below the sample onto a phosphorescent screen or through a camera for viewing images. The regions in which electrons do not pass through the specimen the image is dark.
- Where electrons are un-scattered, the image is brighter, and there are a range of greys in between depending on the way the electrons interact with and are scattered by the sample.
TEM Image Analysis
TEM Image Analysis in s2nano.org
|
ISO |
NanoREG |
ACEnano |
S2NANO |
| Method |
- Set the measurement scale
- Crope image to remove image artifacts
- Thresholding grey scale
- Apply despeckle to remove possible artifacts
- Set the list of measurands desired (such as area, shape descriptors…)
- Analyze the particles
- Export data
|
- Setting and adjusting the threshold value
- Defining the detection area Setting the detection parameters
- Detection of the primary particles in aggregated NM
- Selection of the primary particle parameters
- Defining the classification schemes
- Classification of the particles according the selected parameters
- Exporting of results in excel spreadsheets and storage of the (annotated) images in the NM Database
|
- Obtain are and diameter of >100 particles / 1 sample to plot size histogram
|
- Set measurement scale
- Separate particles & background using grey scale threshold
- Define circularity of NPs
- Obtain area, diameter… of each particle
- Export data to excel format
- Collect data for >300 particles
|
| Software |
- Image J
- IgorPro
- DigitalMicrograph
|
|
|
|
Decision on "NANO"
Decision-Making on "Nanomaterial" using TEM
Making Decision based on
"Good Measurement & Analysis Practice : DLS"
-
DLS Sample Prep.
DLS sample prep. Protocol
MORE
-
-
DLS Data Interpretation
DLS Data Analysis in s2nano.org
MORE
-
Decision on "NANO"
Decision-Making on "Nanomaterial" using DLS
MORE
DLS Principle
DLS Data Analysis in s2nano.org
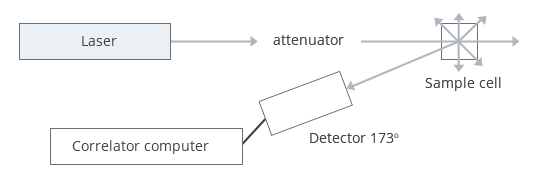
Summary of Technique :
- The technique determine the size distribution profile of small particles in suspension or polymers in solution.
- A monochromatic light source is shot through a polarizer and into a sample. The scattered light goes through a second polarizer and is collected by a photomultiplier.
- By repeating the process in short-time interval, the scattered pattern can be analyzed by an autocorrelator to analyze the light intensity profile of each spot.
DLS Sample Prep.
DLS sample prep. Protocol
| ACEnano |
NanoREG |
S2NANO |
|
NM dispersions: analyze as received. Powder NM samples were dispersed by means of specific dispersion protocol
|
Dispersion stability: conduct the standard measurement. Perform 10 measurements to reach automatic optimization of the software
|
Prepare suspension solution of NPs
|
|
Size: 1 mL of the liquid was injected into the polystyrene cuvette. Minimum of 5 measurements are required.
|
High-accuracy size-data: determine the viscosity of the sample after DLS measurement for data-correction
|
Appropriate sample volume to measure DLS is 3 mL and the minimum volume is 1 mL.
|
|
Zeta Potential: 1 mL of the liquid was injected into the zeta potential cuvette. Minimum of 3 measurements are required.
|
|
|
DLS Standard Measurement
DLS measurement Protocols (NanoReg, ACEnano)
| Factors |
ACEnano |
NanoREG |
S2NANO |
| Instrument |
Malvern Zetasizer (nano ZS) 633-nm laser
|
Malvern Zetasizer (nano ZS) 633-nm laser
|
Malvern Zetasizer (nano ZS) 633-nm las
|
| Scattering angle |
Back-scatter angle 173o
|
Back-scatter angle 173o
|
Side-scatter angle 173o
|
| Temperature |
20oC
|
25oC
37oC
(in vitro/in vivo exposure media)
|
25oC
|
| Replication |
5 consecutive measurements
|
10 consecutive measurements
|
3 consecutive measurements
|
DLS Data Interpretation
DLS Data Analysis in s2nano.org
|
ACEnano |
NanoREG |
S2NANO |
| Output |
Average size distribution
|
Analysis of relative intensity
|
Average size distribution (Z average)
|
|
Zeta potential graph
|
Analysis of average zeta-size
|
Intensity-based diameter
Volume-based diameter
Number-based diameter
|
|
|
Analyze the evolution in relative scattered light intensity and zeta-size as a function of time
|
|
Decision on "NANO"
Decision-Making on "Nanomaterial" using DLS
Making Decision based on
"Good Measurement & Analysis Practice : spICP-MS"
-
spICP-MS Sample Prep.
spICP-MS sample prep. Protocol
MORE
-
-
spICP-MS Data Interpretation
spICP-MS Data Analysis in s2nano.org
MORE
-
Decision on "NANO"
Decision-Making on "Nanomaterial" using spICP-MS
MORE
spICP-MS Principle
spICP-MS Data Analysis in s2nano.org
Summary of Technique :
- Single particle Inductively Coupled Plasma Mass Spectrometry (sp-ICP-MS) is a special type of Inductively Coupled Plasma Mass Spectrometry (ICP-MS) technique developed for the characterization of individual nanoparticles (NPs) in suspension.
- By flowing solutions containing single NPs or their agglomerates at appropriate concentration (about 106 particles/mL) into the inductively coupled plasma (6000-10000 K), each NP will produce an ion cloud which will cause a pulse of mass signal related to the diameter of a NP.
- The sp-ICP-MS can overcome limitations of electron microscopy which requires dry samples, by directly analyzing NPs in liquid suspensions with high throughput to provide composition, mass, and diameter information for thousands of NPs. Moreover, by directly measuring mass of each NP, the sp-ICP-MS minimizes environmental parameters (e.g., temperature and vibration) often observed in other NP characterization methods based on the brownian motion of NPs, such as NTA and DLS
spICP-MS Sample Prep.
spICP-MS sample prep. Protocol
| ACEnano |
NanoREG |
S2NANO |
|
~~~~
|
~~~~
|
~~~~
|
|
~~~~
|
~~~~
|
~~~~
|
|
~~~~
|
|
|
spICP-MS Standard Measurement
spICP-MS measurement Protocols (NanoReg, ACEnano)
| Factors |
ACEnano |
NanoREG |
S2NANO |
| Instrument |
~~~~
|
~~~~
|
~~~~
|
| Scattering angle |
~~~
|
~~~
|
~~~
|
| Temperature |
~~~
|
~~~
|
~~~
|
| Replication |
~~~
|
~~~
|
~~~
|
spICP-MS Data Interpretation
spICP-MS Data Analysis in s2nano.org
|
ACEnano |
NanoREG |
S2NANO |
| Output |
~~~
|
~~~
|
~~~
|
|
~~~
|
~~~
|
~~~
|
|
|
~~~
|
|
Decision on "NANO"
Decision-Making on "Nanomaterial" using spICP-MS
Making Decision based on
"Good Measurement & Analysis Practice : NTA"
-
NTA Sample Prep.
NTA sample prep. Protocol
MORE
-
-
NTA Data Interpretation
NTA Data Analysis in s2nano.org
MORE
-
Decision on "NANO"
Decision-Making on "Nanomaterial" using NTA
MORE
NTA Sample Prep.
NTA sample prep. Protocol
| ACEnano |
NanoREG |
S2NANO |
|
~~~~
|
~~~~
|
~~~~
|
|
~~~~
|
~~~~
|
~~~~
|
|
~~~~
|
|
|
NTA Standard Measurement
NTA measurement Protocols (NanoReg, ACEnano)
| Factors |
ACEnano |
NanoREG |
S2NANO |
| Instrument |
~~~
|
~~~
|
~~~
|
| Scattering angle |
~~~
|
~~~
|
~~~
|
| Temperature |
~~~
|
~~~
|
~~~
|
| Replication |
~~~
|
~~~
|
~~~
|
NTA Data Interpretation
NTA Data Analysis in s2nano.org
|
ACEnano |
NanoREG |
S2NANO |
| Output |
~~~
|
~~~
|
~~~
|
|
~~~
|
~~~
|
~~~
|
|
|
~~~
|
|
Decision on "NANO"
Decision-Making on "Nanomaterial" using NTA