Laboratory
-
TEM Principle
-
TEM Sample Prep.
-
TEM Measurement
-
TEM Data Analysis
Overview of Analytical Technique
Electron Microscopy (EM) techniques, such as transmission electron microscopy (TEM) and scanning electron microscopy (SEM), are the most common analytical techniques used for the characterization of nanoparticles in powder form. Due to their capability of providing high resolution images, EM techniques are widely used to characterize the size and shape of NPs and their agglomerates. However, in the case of NPs in liquid suspensions, sample preparation for EM generally requires a drying procedure, which requires attention because it may affect the agglomeration state of the nanoparticles.
Similar to optical microscopy, TEM is a microscopy method that magnifies small objects that are invisible to humans. Instead of using visible light as in an optical microscope, TEM uses an electron beam to transmit through sample. Electrons are emitted from an electron gun by thermionic source (W or LaB6) or a field-emission (W) source. Field-emission sources provide more monochromatic electrons while thermionic sources are less monochromatic [2]. An electron beam accelerated to high voltage (e.g. 80-500 kV) passes through a thin sample. The sample must very thin in order to transmit sufficient electrons to form an image while minimizing scattering energy loss.
In general, the thickness of the sample should be less than 100nm, depending on the density and elemental composition of the sample and the desired resolution. A condenser-lens system focuses and confines the electron beam before the beam illuminates the sample. The electrons passing through the sample use an objective-lens system to construct a sample image on a fluorescent screen or a charge coupled device (CCD) camera.
Thin processing of sample thickness requires electropolishing and ion-beam etching in material science, and special techniques such as ultramicrotomy of stained and embedded tissues or cryo-fixation are necessary in biosciences[1]. Due to its capability of providing high resolution images, TEM is one of the most powerful tools for characterizing the size and shape of NPs and their agglomerates.
References
- [1] Ludwig Reimer, Transmission electron microscopy: physics of image formation and microanalysis, Vol. 36 (Springer, 2013).
- [2] David B. Williams, and C. Barry Carter, Transmission electron microscopy (Springer, Boston, MA, 1996).
- [3] https://warwick.ac.uk/fac/sci/physics/current/postgraduate/regs/mpagswarwick/ex5/techniques/structural/tem/
- [4] Stephen B. Rice et al., "Particle size distributions by transmission electron microscopy: an interlaboratory comparison case study," Metrologia, 50, 663-678 (2013).
Sample Preparation
TEM samples are loaded onto a Cu grids for the measurement. In order to be loaded onto the Cu grid, solid samples such as nanoparticles in powder form must be well dispersed in solvents such as deionized water, ethanol, propanol, etc.
Solid powder
Powder or solid particles are placed in solvent and dispersed using a sonicator.
Liquid suspension
Dilute the sample using a vortexer or bath-type sonicator if necessary.
Loading to Cu Grid
- Drop about 2uL of dispersion solution onto a Cu grid placed on the surface of parafilm.
- Wait for 5 minutes, then place the sharp edge of the filter paper next to the edge of the Cu grid, extract the excess solution and dry the sample. Once the sample is completely dry, TEM measurement is ready.
- Note that the drying procedure may cause agglomeration of nanoparticles in the liquid suspension.
Notes
- To obtain a sufficient amount of samples from the Cu grid, the concentration of the dispersed or diluted solution is important. The optimized concentration depends on the sample size, structure, etc.
- The above instructions for sample preparation apply to whole mount TEM measurement that do not require thin-section slicing of samples as in thin-section TEM. For thin-section TEM, ultramicrotome is required for making thin samples (less than 100 nm thick) and loading onto the Cu grid (this process is not described here).
Measurement
Instrument Information
- 1. Instrument: JEOL JEM-2010/JEM-2100F
- 2. S/W: ImageJ (https://imagej.nih.gov/ij/)
Instrumental setting for experiment
- 1. Attach the Cu grid on the sample holder and insert the sample holder into TEM instrument.
- 2. Turn on the vacuum pump and turn on the filament (electron beam generator).
- 3. Adjust the magnification to a low level (about 300 - 1000) to find the approximate sample position.
- 4. Increase the magnification to a higher level (about 3000 - 40000) to clearly identify the sample and record the image of the sample. For good focus, limit the sample area to small areas.
Notes
The number of nanoparticles measured affects the uncertainty of the mean and standard deviation of the measurement results, so a sufficient number of nanoparticles are required for the image. In general, more than 500 nanoparticles are recommended for analysis [4].
Data Processing & Analysis
The following steps are used to extract diameter distribution of nanoparticle sample.
-
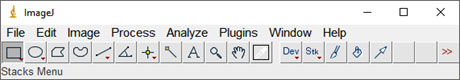
- Run ImageJ software (https://imagej.nih.gov/ij/):
-
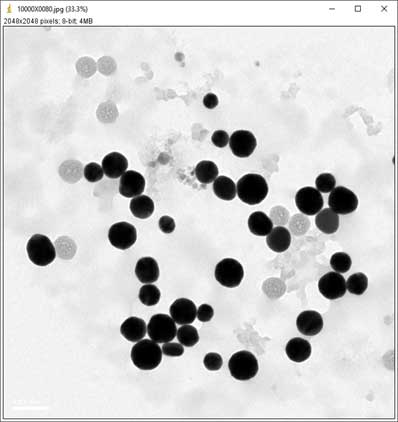
- Drag and drop an image file or an images folder to the main window of ImageJ software:
-
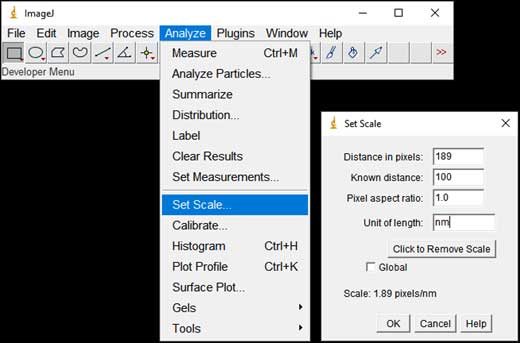
- Set the scale of the image(s): Analyze → Set Scale
-
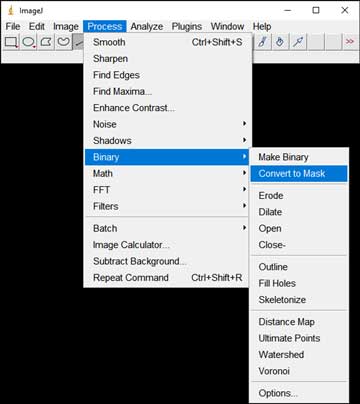
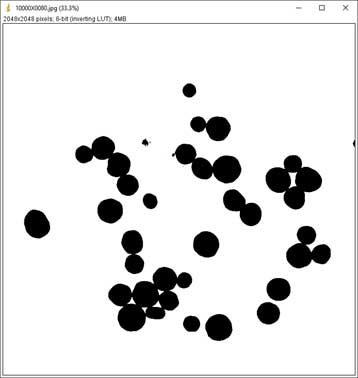
- Convert the image(s) to black and white: Process → Binary → Convert to Mask
-
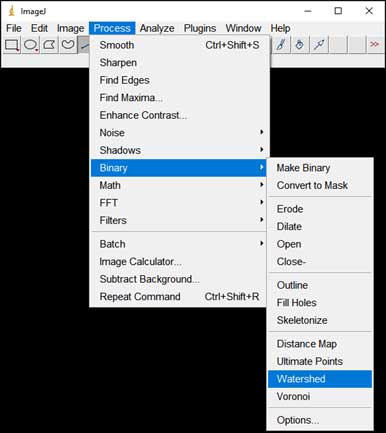
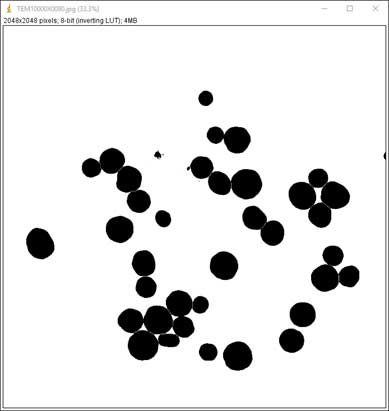
- Split particles too close to each other: Process → Binary → Watershed
-
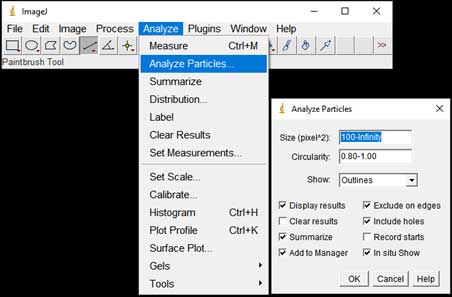
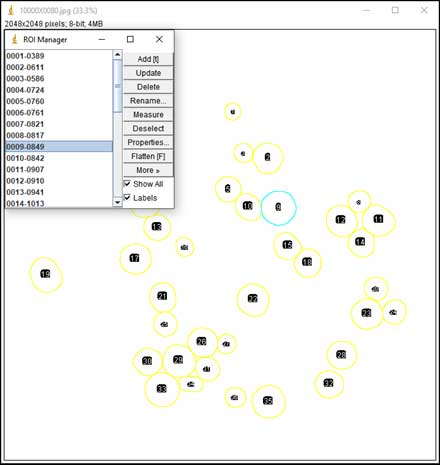
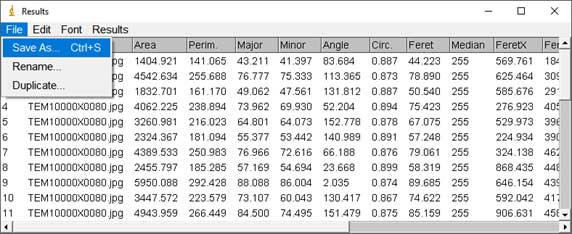
- Particle counting starts: Analyze → Analyze Particles; Choose range of Size, Circularity (a parameter for measuring the roundness of particles). The software is based on black and white contrast to mark particle position and boundaries. A list of particles with parameters such as Area, Perimeter, Feret Diameter, etc. will be displayed in the result table.
-
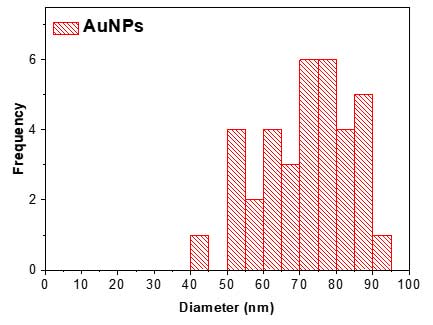
- In the results table, user can save the particle list and parameters in Excel format and use the data for visualization. For example, Feret Diameter column can be used to draw a diameter histogram using OriginPro software (Academic version 2016).